The Process Of Designing The 21st Century Pitch
The Process Of Designing The 21st Century Pitch
Nate Walker breaks down the data and analytics for softball pitchers. What does it mean and how we can begin to blend this information with training?
Nate Walker is a former baseball operations employee for two Major League Baseball front offices where he served as a liaison to the Major League coaching staff, assisting them with game preparation, in-game strategy, and statistical research. Nate is currently the Founder and President of Diamond Solutions, an analytics consulting firm that assists softball and baseball organizations with their analytical needs. If you would like to learn more about Nate, please click here for a recent interview.
Softball is going through an exciting transition. Over the past few months, I have noticed more and more coaches utilizing pitch-tracking technologies to improve their player development process. Players are now getting access to game-changing data that can drastically improve their careers, and it has become increasingly obvious that they are starting to demand this information when they are honing their craft.
As great as this is, coaches now face a new challenge of figuring out ways to fuse large amounts of data with their personal coaching style. Given that pitch-tracking technologies like Rapsodo and FlightScope are becoming more popular throughout the softball world, I figured it would be beneficial to reveal more about my analytical process when I assist international, professional, collegiate, and amateur teams/players with their pitch-tracking data needs.
This article will be part one of a three-part series on softball pitch design. Part one will share how my softball research and time working for the Tampa Bay Rays and Toronto Blue Jays helped create my personal analytical process. Part two will provide an example of how to implement this process by revealing the details and results of a pitch design program we developed for a Division I pitcher. Finally, Dana Sorensen of Symbiotic Training will write part three and explain how proper sports performance training affects the pitch design process.
Getting Started
One of the more popular questions I get asked about pitch-tracking data is, “What are the optimal spin/movement numbers a pitcher should be generating?” If you read my last article, you should know that the answer to that question is, “It depends.”
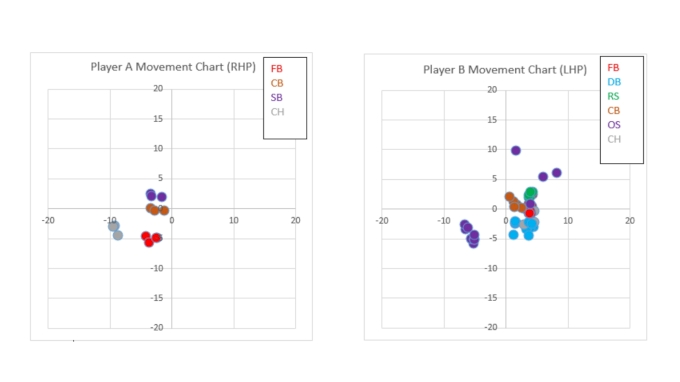
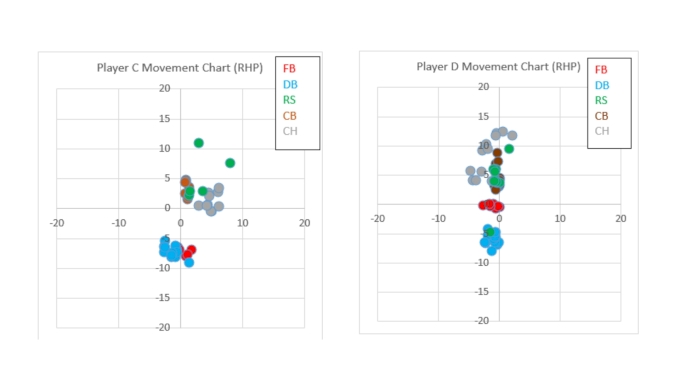
Below are movement charts of four All-American pitchers (to learn how to read a movement chart, please click the link to my first article above). You should notice that the shapes of these movement charts are all different. Player A has a deceptive layering repertoire where she throws three pitches at three different vertical levels all with similar horizontal breaks, Player B is an example of a horizontal-based repertoire, Player C is a sink-based repertoire with some layering effects, and Player D is an example of a vertical pitcher. Clearly, these charts show that there is more than one way to dominate a hitter.
So how do we know what numbers to recommend for different pitchers? For starters, we need to figure out what characteristics produce the most successful results at the collegiate level.
The Big League Process
Before we explain more about our recent softball research, I think it is important to show how MLB teams structure their pitch-tracking data so Rapsodo/FlightScope users can see the difference between their approach and an advanced data approach.
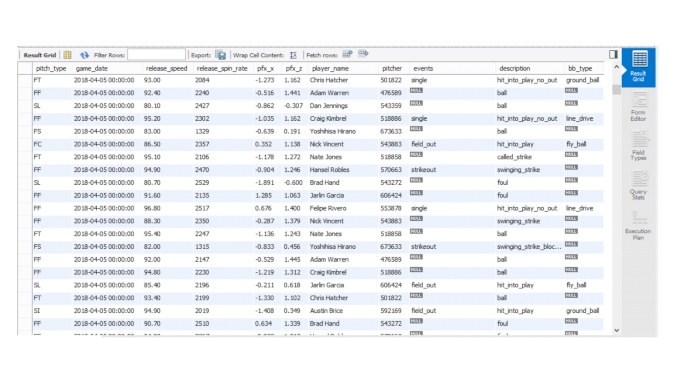
Every time a Major League pitcher throws a pitch, a TrackMan radar collects approximately 75 columns of data. After the game is completed, TrackMan exports millions of data points to a table in each team’s proprietary database for statistical analysis. Below is a screenshot of a sample MLB Front Office Statcast database that I use for my personal analysis. This table hosts data for every pitch in the Major Leagues from 2015-2018 which allows me to stay up to date on the latest data trends that are occurring throughout the league. If you look closely at the picture, you should notice that each row has a result associated with each pitch (i.e., ball, swinging_strike, hit_into_play). This type of data structure allows teams to create Machine Learning algorithms that identify movement/spin/velocity combinations that have the highest probability of producing a favorable result (swinging strike, ground ball, weak contact, etc.).
The reason why teams utilize advanced statistical methods to analyze pitchers is because pitching in itself is extremely complex. There are numerous reasons as to why a pitcher gets a hitter out (velocity, vertical and horizontal movement, spin, command, deception, trajectory, etc.) therefore teams need to deploy advanced statistical techniques so they can accurately identify predictive signals of future success. Softball does not have nearly the amount of data required to run these advanced algorithms, however, Diamond Solutions has been able to create a smaller softball pitch-tracking database (includes general statistics like ERA, K/7, etc.) in order to make better sense of this information.
The Softball Process—Analyzing Rise
Since there is no public pitch-tracking data source for softball, we have been traveling all across the country with our Rapsodo radar to obtain what I like to call a normal distribution of talent. A normal distribution of talent is simply a sample of pitchers whose talent ranges from a below-average high school pitcher to potential 2020 U.S. Olympian.
The major benefit of this approach is it minimizes sample bias which makes it easier to determine why certain pitchers succeed and why others do not. Essentially, Diamond Solutions is performing a softball science experiment. We use Major League Baseball as our research library where we analyze the Front Offices’ and public analysts’ data theories and determine how they apply to a softball pitcher’s repertoire.
For example, one of the more desirable analytical traits for a baseball pitcher is the ability to generate a high amount of vertical break on the fastball, also known as fastball “ride.” When a pitcher can ride a fastball, the ball possesses a high amount of backspin and defies gravity longer than an average fastball would, ultimately making the pitch appear as if it is rising when it approaches home plate (the pitch is not technically rising).
Ride is the baseball version of rise, and it has become a fastball trait that teams target because it is strongly correlated with swinging strikes, especially when the pitch is located up in the zone. Before digging into the softball data, I am going to list some subjective reasons as to why softball hitters might have the same struggles against riding/rising pitches as baseball players do.
First, a hitter’s upward swing trajectory stays on plane better with a pitch that is breaking down, especially now that hitters are placing an extra emphasis on hitting the ball in the air. If a ball is generating good “rise” and approaches home on an upward trajectory, a hitter will have a very difficult time matching the plane of the pitch if she has an upward swing trajectory.
Second, hitters practice the majority of their swings on pitches down in the zone. When a hitter hits off the tee, where in the zone is the tee positioned? Down in the zone. How about the location of front toss pitches? Down in the zone. How about batting practice? Again, down in the zone. And where do most pitching coaches tell their pitchers to command the ball? Once again, down in the zone.
When a pitcher is able to consistently establish up in the zone with a vertical pitch (rise, curve, screw), the hitter will potentially struggle because she has spent the majority of her time training for pitches that are breaking towards the bottom of the zone. Additionally, the vast majority of college pitchers throw their rise/screw/curve with a high amount of bullet spin, therefore true backspin can seem foreign to a hitter’s eyes.
Now that we have established some subjective reasons as to why a softball hitter would struggle with a rising pitch, it is time to look at the numbers and see if our theories have merit. One of the biggest advantages of managing a database is having the ability to ask a question and answer it immediately.
For example, according to my sample of pitches, the beginning of an above-average vertical break range for a riseball is approximately two inches. If I wanted to see the median strikeouts per 7 innings (K/7) for pitchers who averaged two or more inches of vertical break on their riseball, I could write a few lines of code in my database, and the median K/7 number will appear on my screen in less than 5 seconds.
It turns out pitchers who throw riseballs that generate two or more inches of vertical break have a median K/7 of around 8 while pitchers below that two-inch threshold have a K/7 of approximately 5.5. In other words, that is a difference between an average college pitcher and a potential All-American. Please keep in mind that my softball database is still growing (we are on pace to track around 200 pitchers by the end of the year), so this large difference in K/7 will probably shrink over time as our database grows, but there is early evidence that suggests pitchers with an above-average vertical pitch miss more bats than pitchers who do not. In order to further explore this theory, we can run some correlation tests to better confirm our thoughts.
Test the Correlation—Rise and K/7
In the table below, I have outlined the results of a basic correlation test that notes the direction of the trend line and analyzes the strength of the correlation between riseball rise and K/7.
| Direction of Trend Line | Pearson Correlation Coefficient |
| Positive | 0.31 |
For those unfamiliar with the statistical terms listed above, a Pearson correlation coefficient is a number between -1 and 1 that “indicates the extent to which two variables are linearly related” (SPSS Tutorials). -1 represents a completely negative correlation (as X increases, Y decreases), 0 represents no correlation, and 1 represents a completely positive correlation (as X increases, Y increases).
Our Pearson correlation is 0.31 which signifies a moderate positive correlation. So how do we interpret this number? The rise of a riseball correlates to missing bats, but it does not explain the entire story. These numbers make sense since strikeouts occur as a result of a combination of many different factors such as velocity, command, sequencing, total movement, relative movement, and the quality of her other pitches.
Now, does that Pearson Correlation number seem significant after listing all those potential reasons as to why a hitter could strikeout? Yes, especially when other Pearson tests (not pictured) reveal that riseball rise had a stronger correlation to K/7 than riseball velocity and fastball/dropball velocity (slightly). Once again, these numbers could change once our database grows, however, there is more early evidence that suggests rise is a potential separating factor for a pitcher’s ability to generate strikeouts. If we wanted to get a better understanding of how rise affects a pitcher’s ability to miss bats, we should have tested the relationship between the rise and swinging strike rate (swinging strikes per pitch). Unfortunately, we need to collect more softball game data (a FlightScope radar is able to collect game data) in order to run an MLB type model.
One potential flaw with using a Pearson correlation test to analyze pitchers is pitching is not necessarily a linear evaluation process. The single biggest mistake a coach can make with this data is to have a linear mindsight when analyzing data and assume that the more/less of one metric, the better/worse the pitcher will become.
For example, a coach could try and drastically increase the movement of a pitch when in reality it could tunnel very well with a different pitch if it only underwent a slight movement change. So why did we use this test in the first place? Well, we need to start somewhere. A Pearson correlation test is a great way to note emerging trends that are worth further research.
Once an MLB team thinks they have identified a trend that could potentially give them a competitive advantage, analysts deploy more advanced statistical techniques so management can determine whether or not they should adjust their player acquisition/development strategy. Remember, pitching is complex and cannot be narrowed down into one simple linear formula. If pitch-tracking data is as simple as reading the data off an iPad/computer app, why would teams invest millions of dollars to figure out how to best implement this data within the organization?
The Future
Having worked in two MLB Front Offices, I can say with great confidence that pitch-tracking data is extremely predictive of a pitcher’s success and when used properly in a player development setting, can provide a coach with a major competitive advantage over his/her counterparts.
The process in which a coach communicates and implements this information is extremely important because it provides the foundation for a data-driven plan that will improve the player’s value. The work required to create these analytical processes is and should be intense which is why we will continue to collect more pitch-tracking data to give these numbers more meaning and help grow the game of softball. After all, a simple answer very rarely solves a complex question. As Nate Silver, the founder of the website FiveThirtyEight, said in his bestselling book The Signal and Noise, “Before we demand more of the data, we have to demand more of ourselves.”
What’s Next?
Thank you for taking the time to read this article. If you have any questions or comments, my contact information is listed on the front page of my website. Before I officially wrap this article up, I also want to announce that I will be attending the Florida State Softball Winter Camp (12/14/-12/17) with Dana Sorensen of Symbiotic Training where we will be collecting and analyzing the campers’ pitching data.
Start The Symbiotic Pitching Program with Dana Sorensen & Jono Green
If you are at the camp, don’t be afraid to come up to us (we’re the ones with the radar set-up) to say hi or ask questions. Additionally, the Florida State coaching staff has given us permission to sell our camp analysis to the attending pitchers. If you would like more information on the individual pitcher analysis package, please send me an email (nhwalker34@gmail.com). Thanks again for reading, and hopefully I will see some of you on the road. In the meantime, keep a lookout for Part II of this article which I will release after the Florida State Winter Camp.